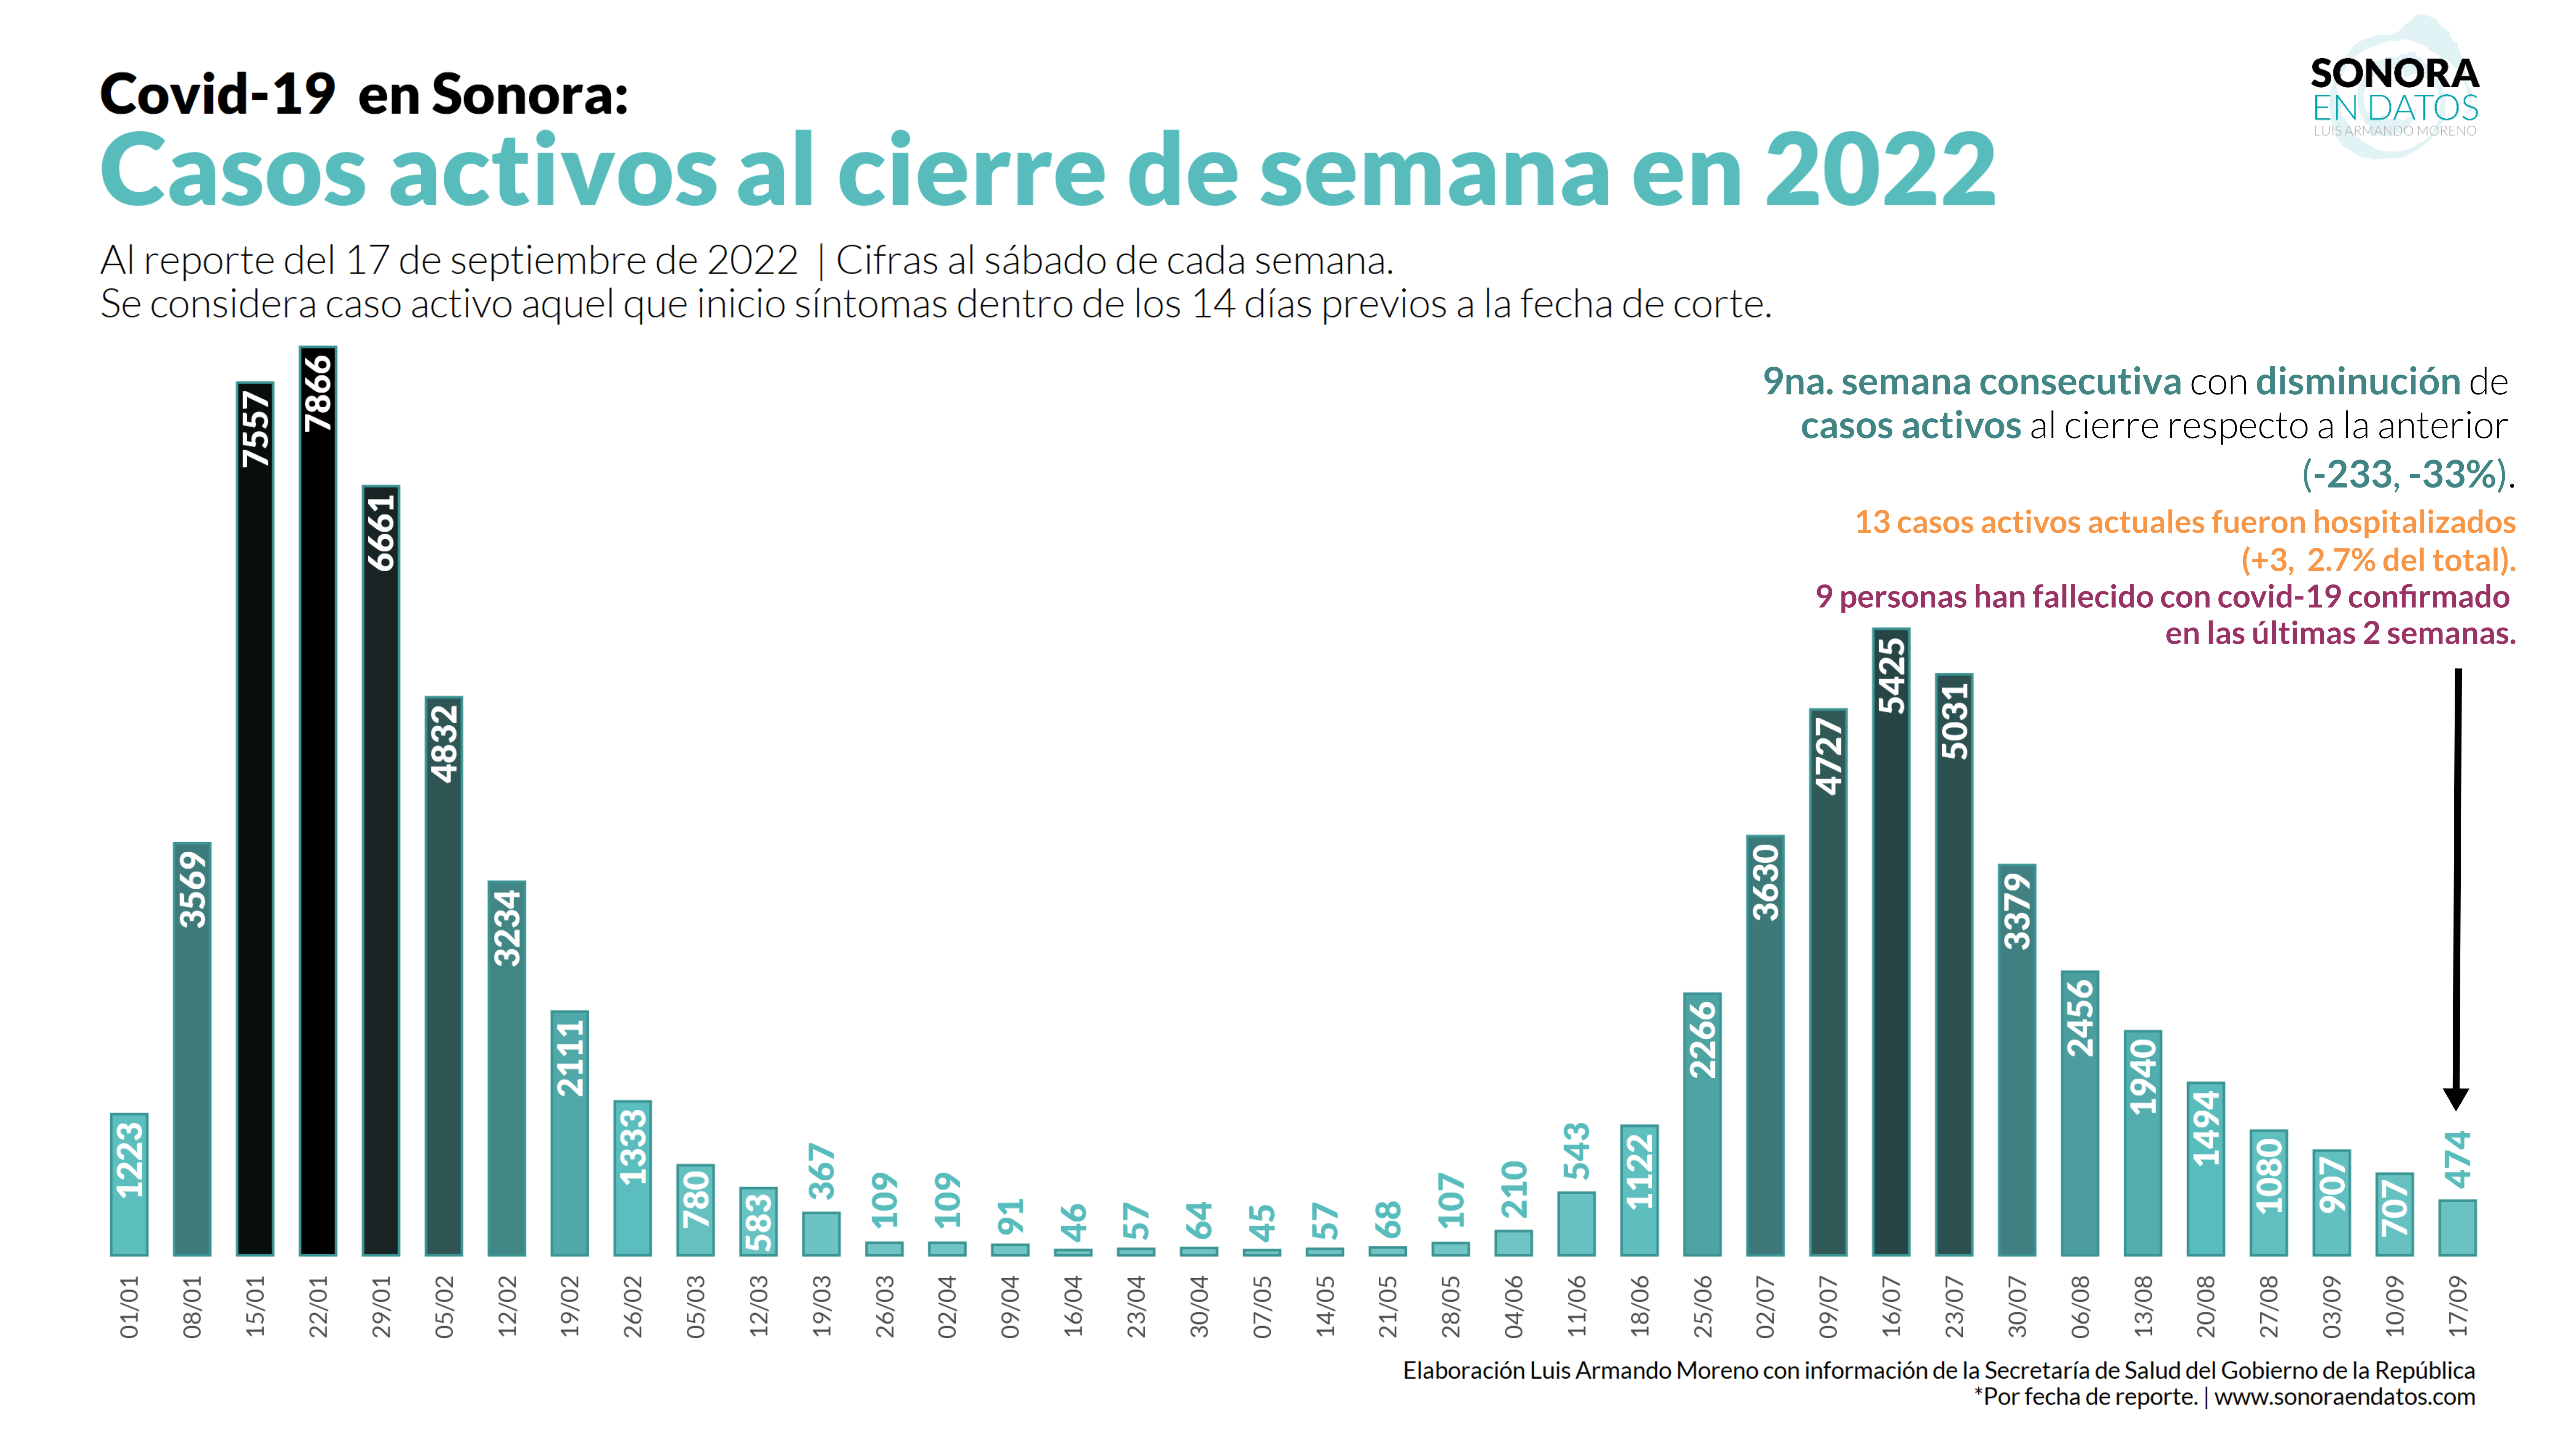
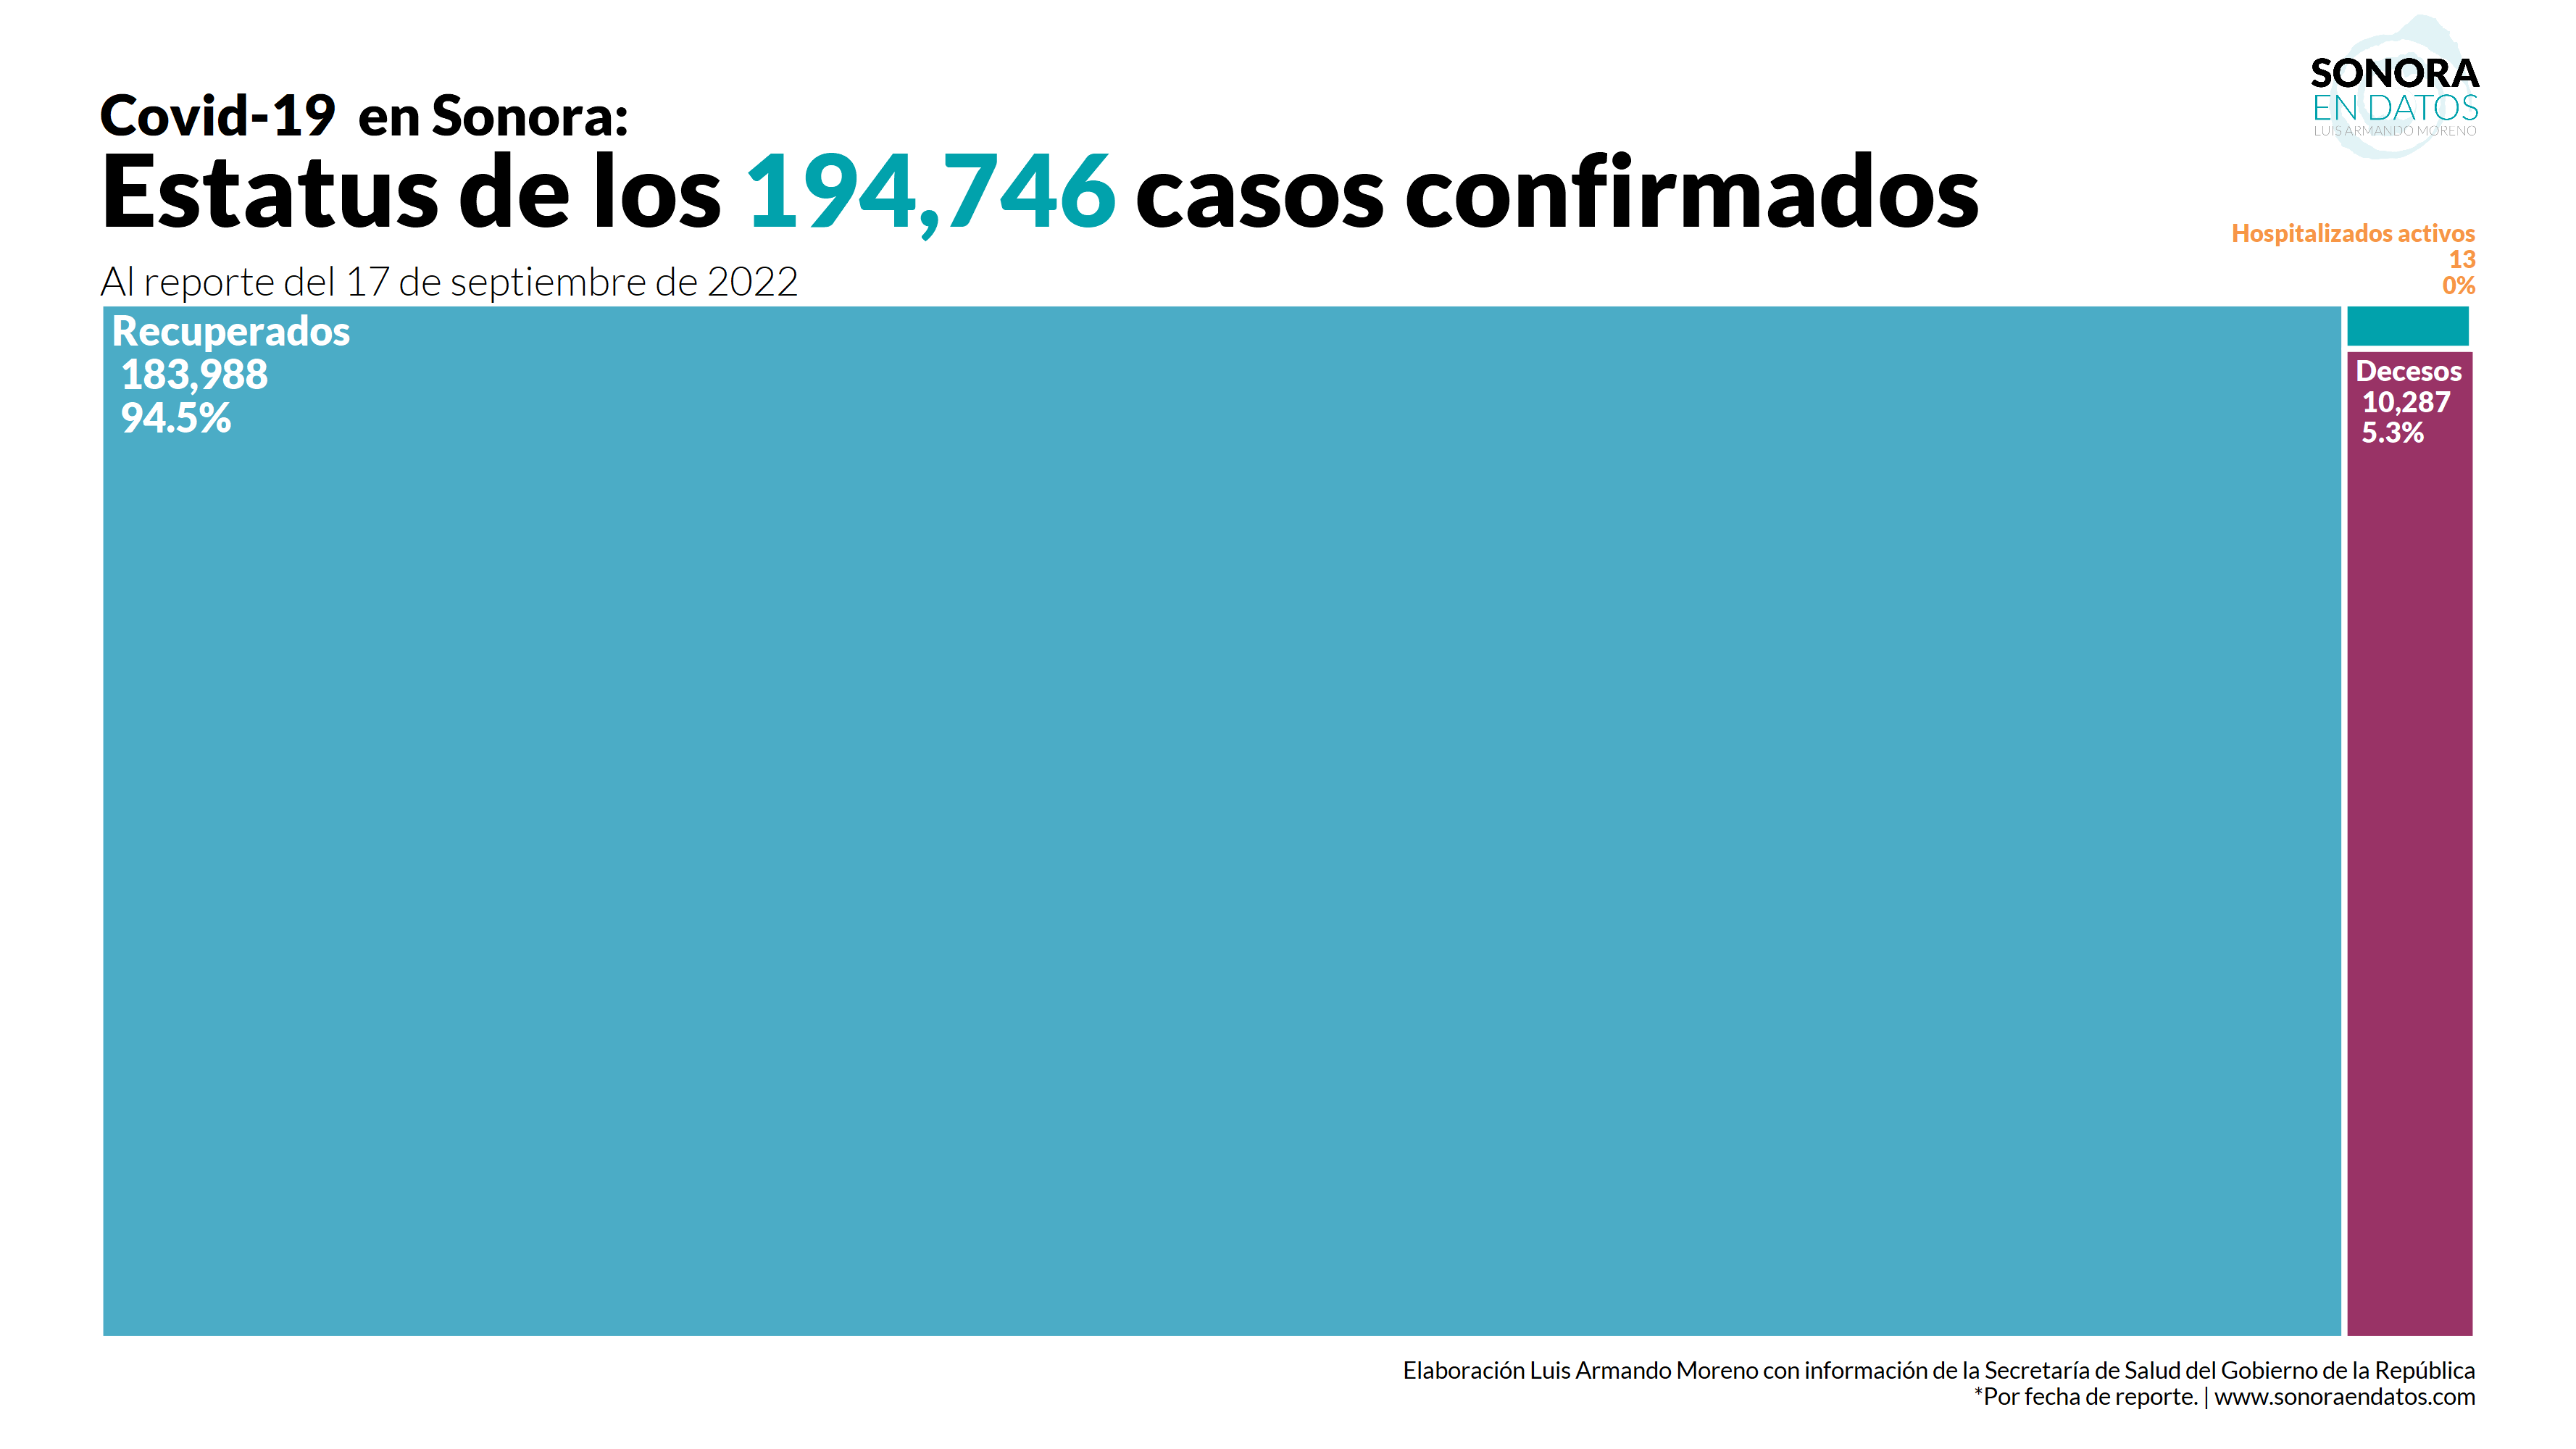
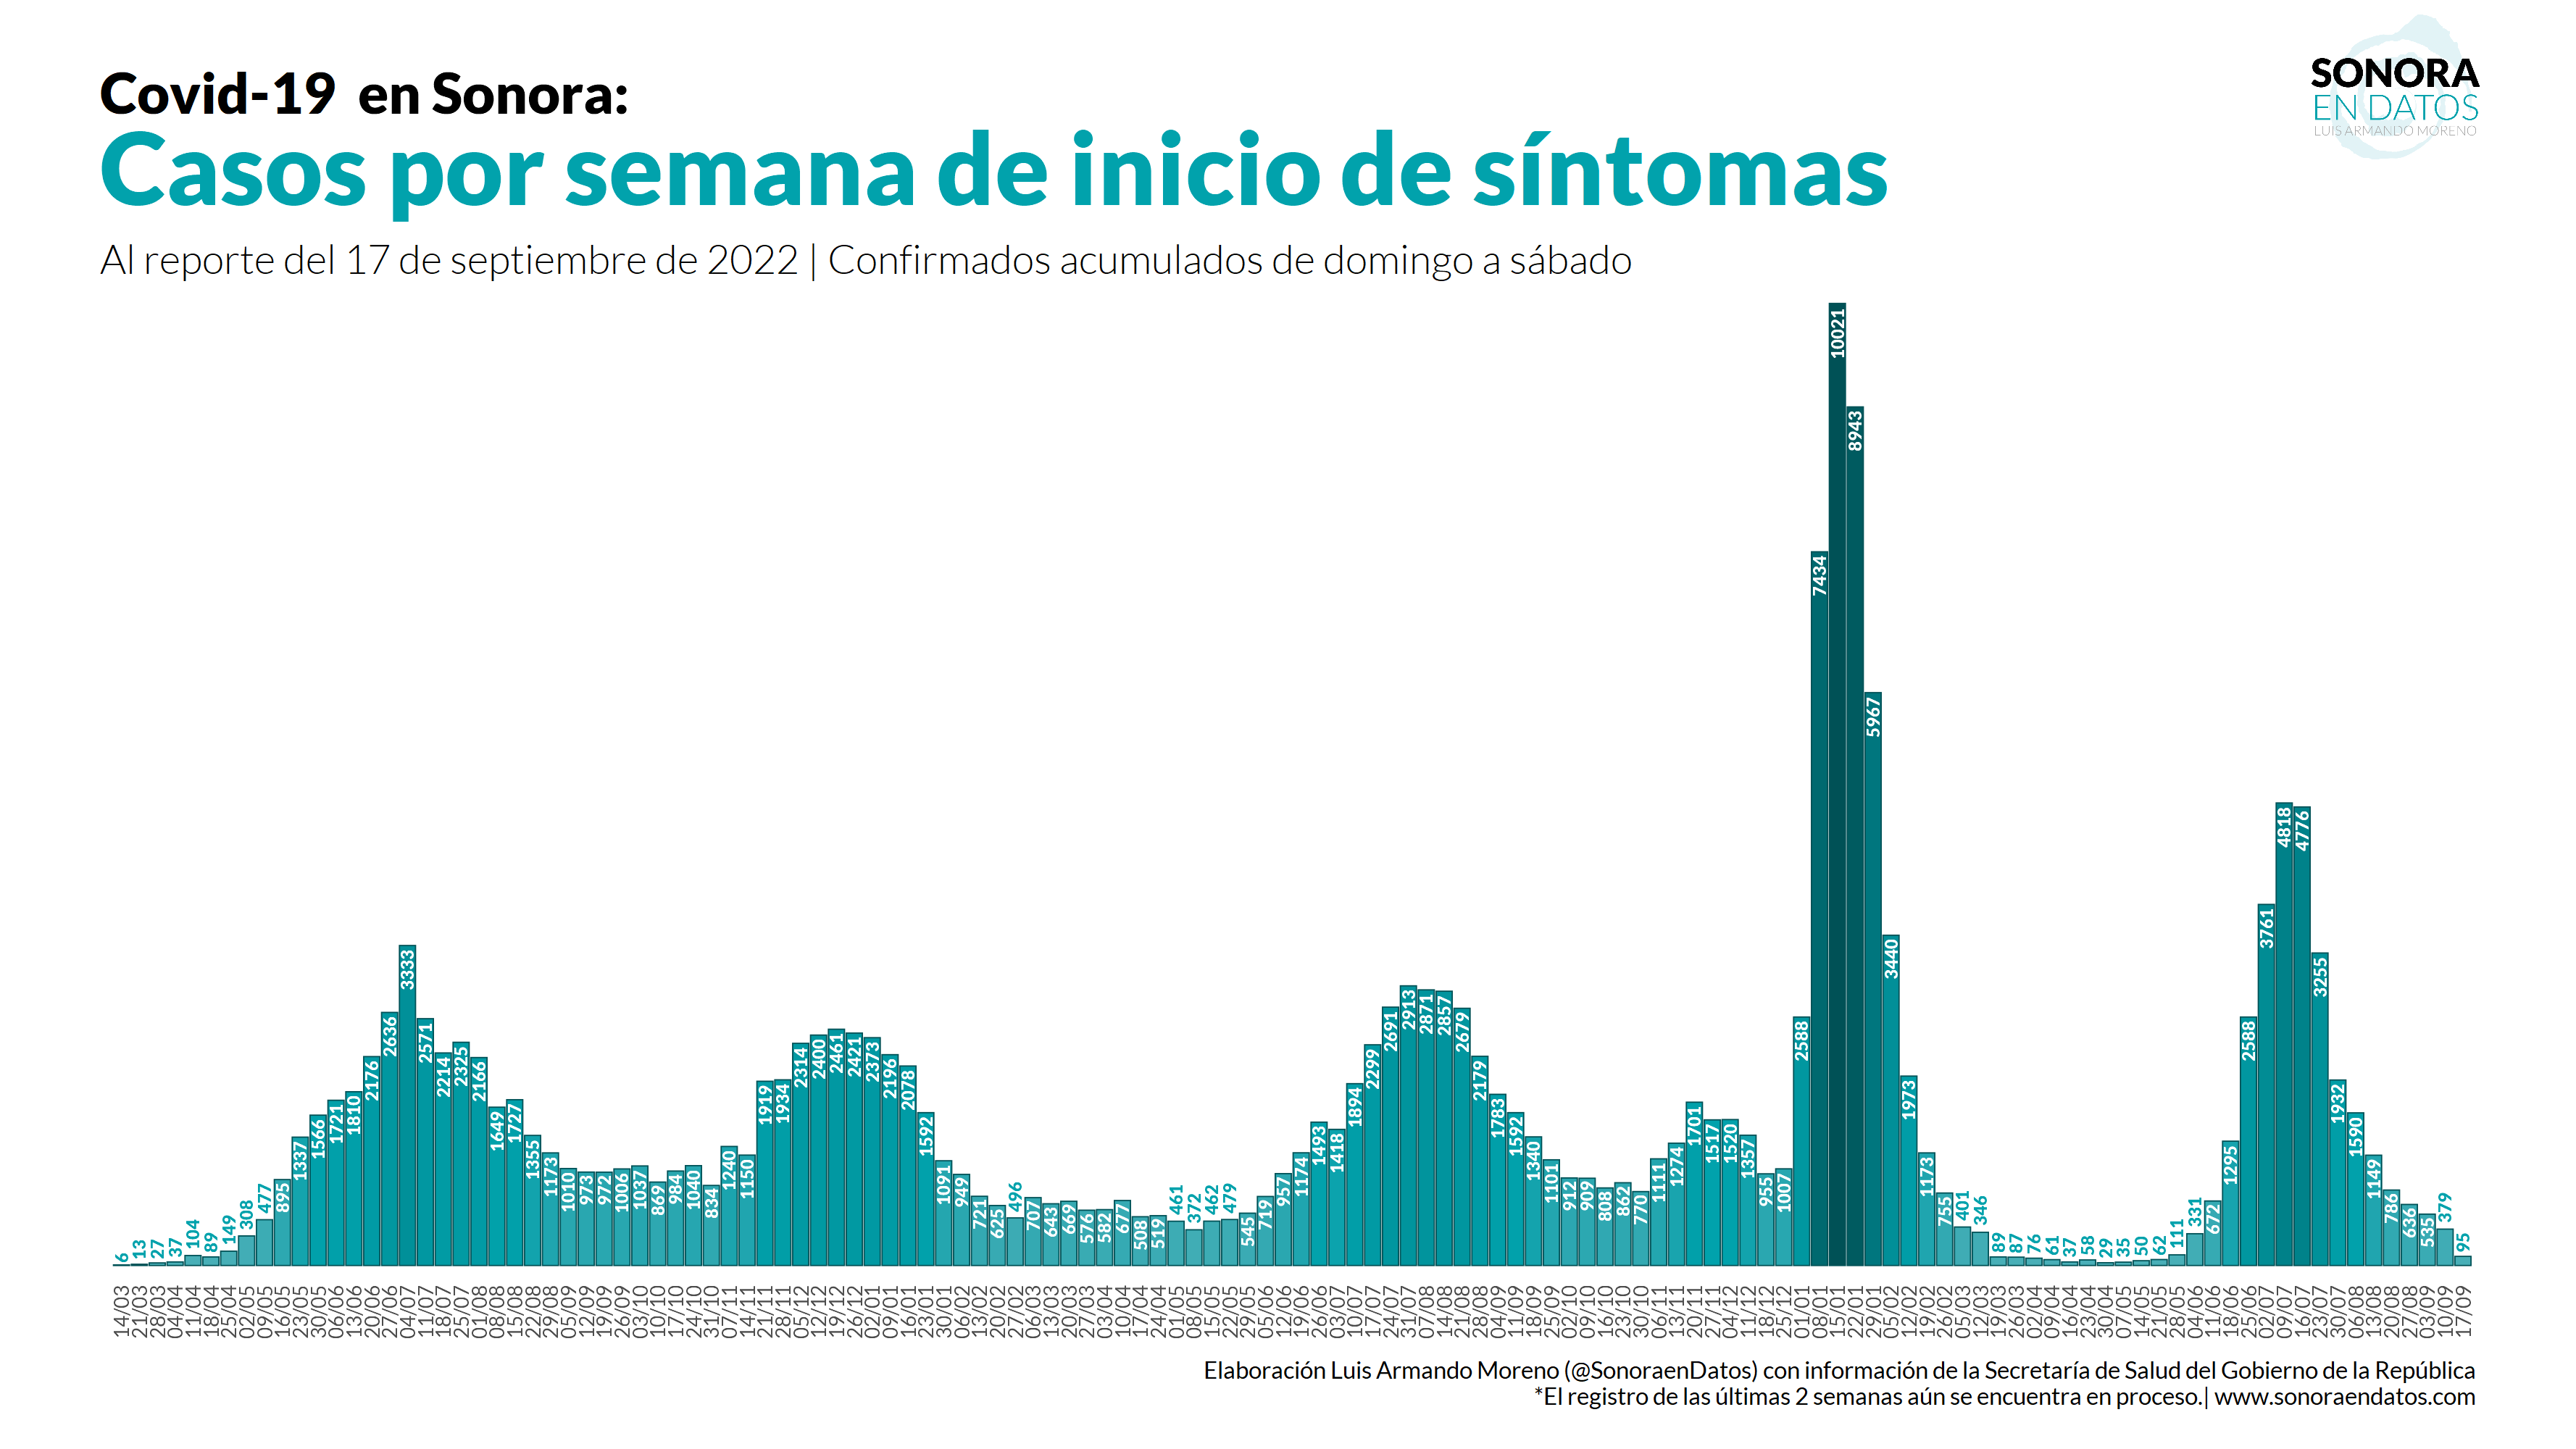
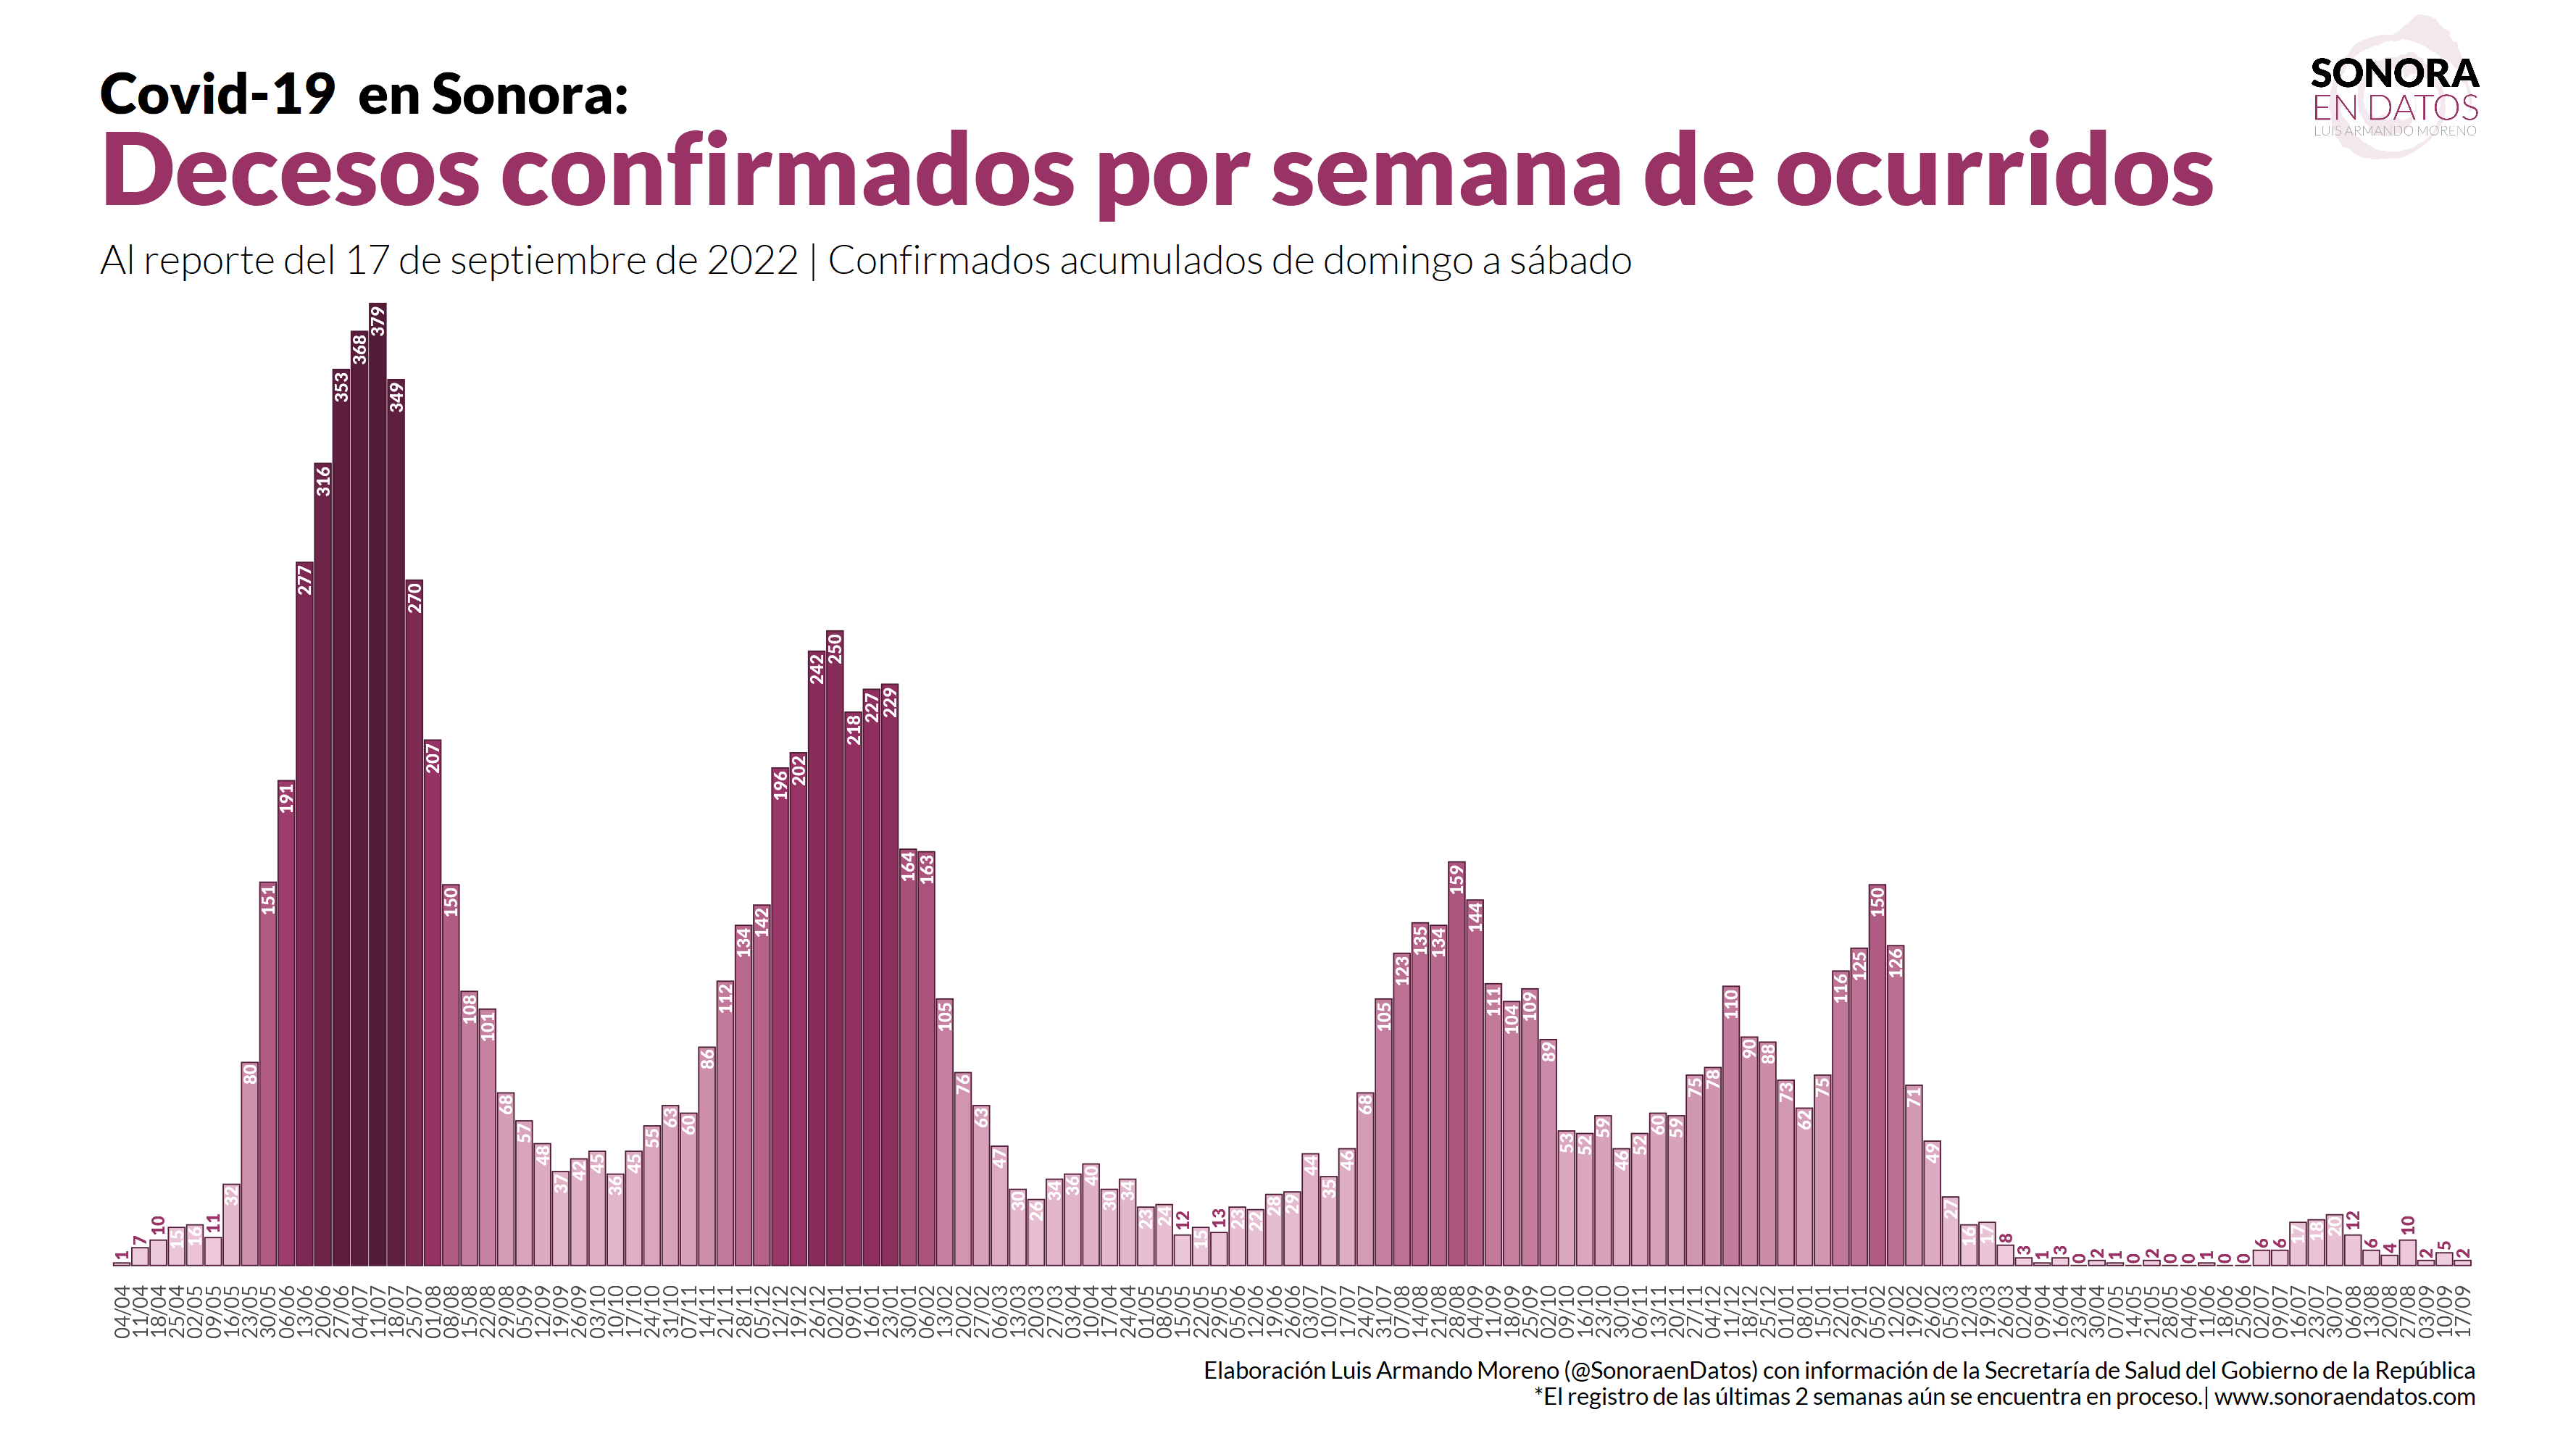
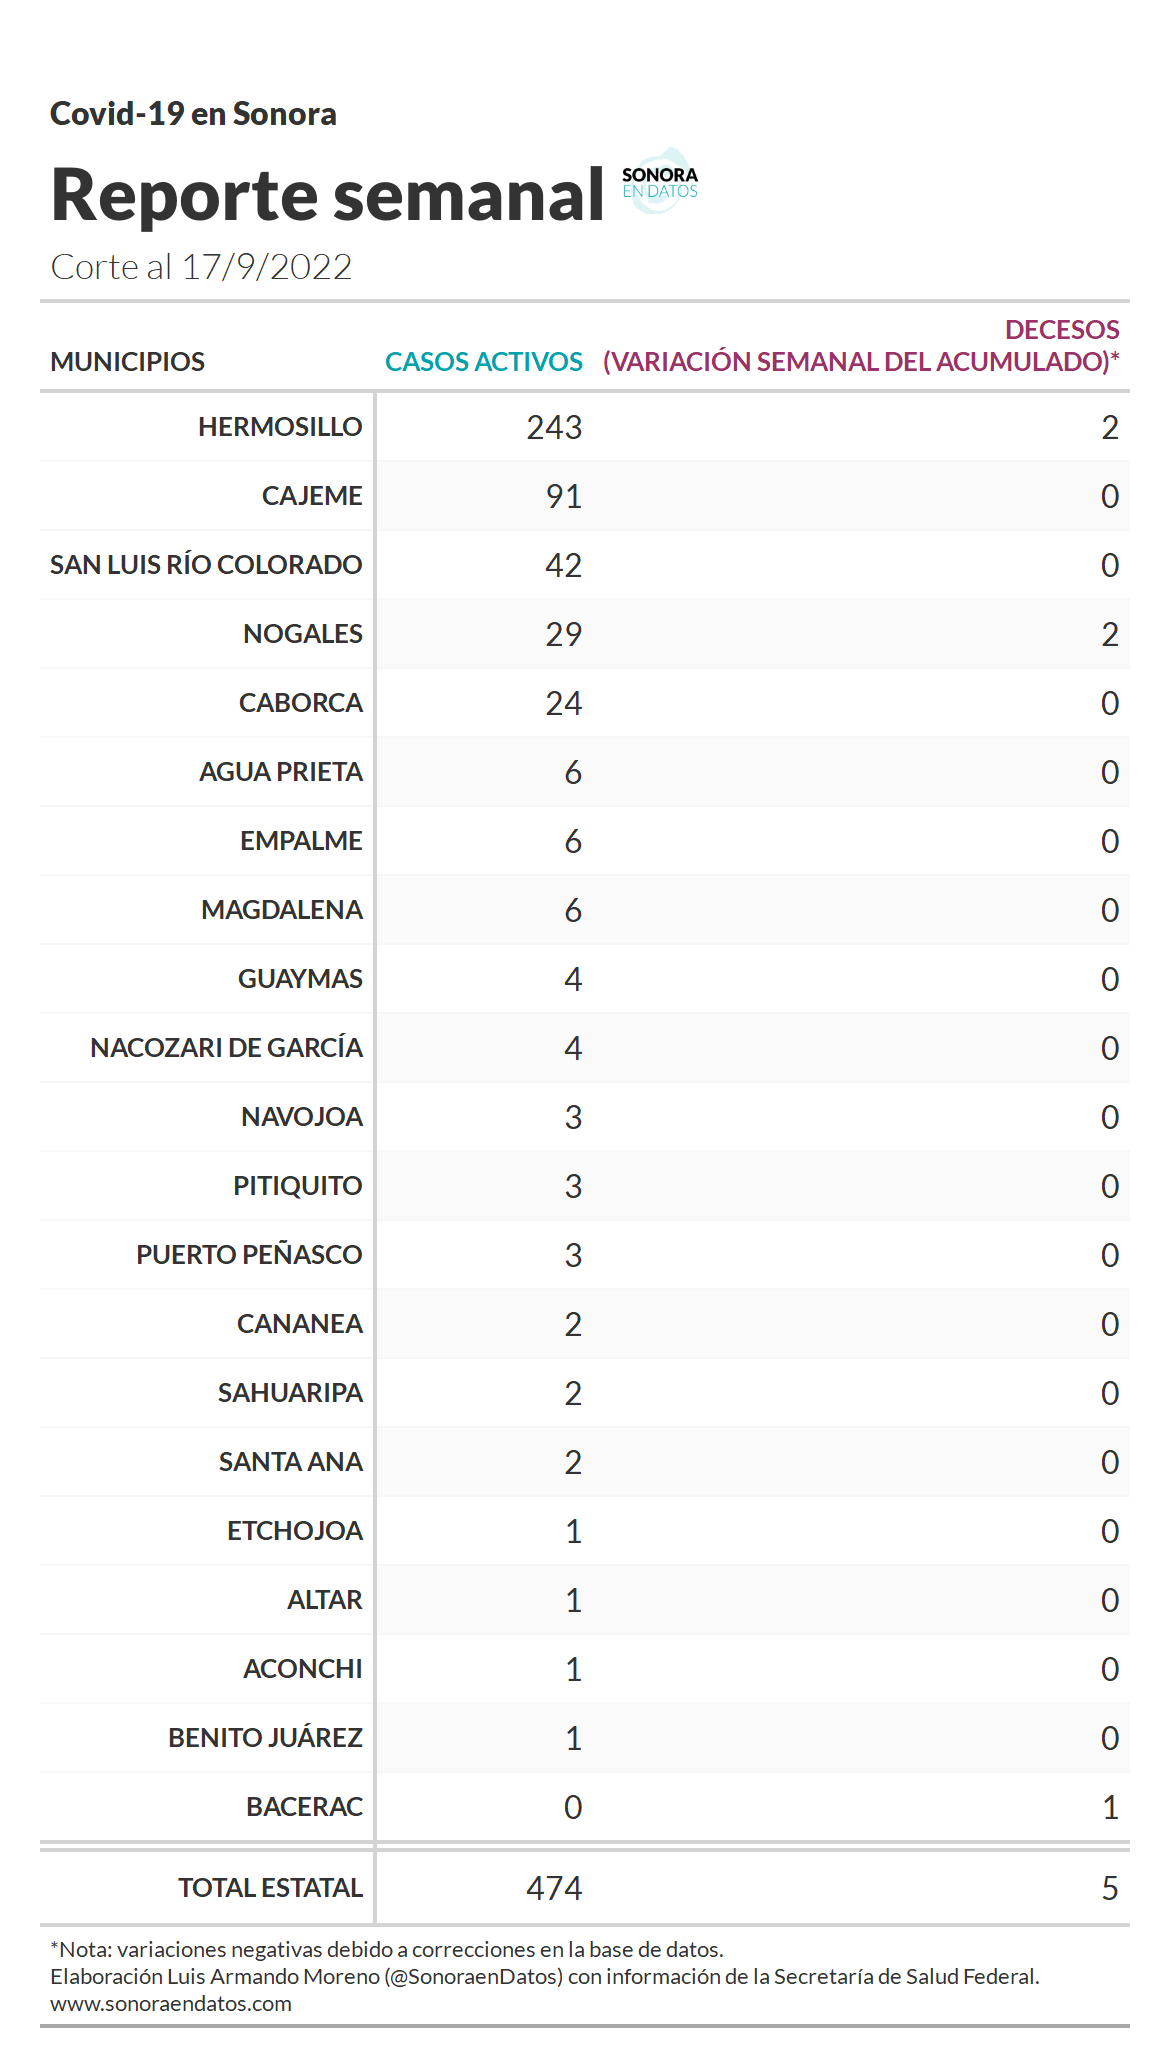
Información de la Secretaría de Salud del Gobierno de la República según el registro publicado en datos abiertos, semanas medidas de lunes a domingo por fecha de corte.
Click en el gráfico para agrandar1
![](https://raw.githubusercontent.com/dogomoreno/Covid-19-en-Sonora/master/Reporte/s28f.png)
![](https://raw.githubusercontent.com/dogomoreno/Covid-19-en-Sonora/master/Reporte/s02.png)
![](https://raw.githubusercontent.com/dogomoreno/Covid-19-en-Sonora/master/Reporte/s03sint.png)
![](https://raw.githubusercontent.com/dogomoreno/Covid-19-en-Sonora/master/Reporte/s09d.png)
![](https://raw.githubusercontent.com/dogomoreno/Covid-19-en-Sonora/master/Reporte/s04.png)
![](https://raw.githubusercontent.com/dogomoreno/Covid-19-en-Sonora/main/Gr%C3%A1ficos%20semanales/s05.png)
![](https://raw.githubusercontent.com/dogomoreno/Covid-19-en-Sonora/master/Reporte/evolucionrelativa.png)
Gráficos regionales
![](https://raw.githubusercontent.com/dogomoreno/Covid-19-en-Sonora/master/Reporte/diariomapinci.png)
https://dogomoreno.github.io/Covid-19-en-Sonora/#mapa-municipal
![](https://raw.githubusercontent.com/dogomoreno/Covid-19-en-Sonora/master/Reporte/regional/Centro%20Norte.png)
![](https://raw.githubusercontent.com/dogomoreno/Covid-19-en-Sonora/master/Reporte/regional/Noroeste.png)
![](https://raw.githubusercontent.com/dogomoreno/Covid-19-en-Sonora/master/Reporte/regional/Sierra%20Alta.png)
![](https://raw.githubusercontent.com/dogomoreno/Covid-19-en-Sonora/master/Reporte/regional/Sierra%20Centro.png)
![](https://raw.githubusercontent.com/dogomoreno/Covid-19-en-Sonora/master/Reporte/regional/R%C3%ADo%20Sonora.png)
![](https://raw.githubusercontent.com/dogomoreno/Covid-19-en-Sonora/master/Reporte/regional/Sur.png)
![](https://raw.githubusercontent.com/dogomoreno/Covid-19-en-Sonora/main/Gr%C3%A1ficos%20semanales/tablacasossemana.png)
- Todos los gráficos en #Rstats. ↩